


Mapping regional metal flows from mine ownership to final consumption
The goal of this project is to build sankey diagrams to map the value chains of metals. We build over 100,000 Sankey diagrams to visualize metal flows across 159 countries and 4 world regions, covering three key steps: mine owner nationality, extraction region, and final consumption region. The first tab shows the sankeys with the production-based account and the consumption-based account. The second tab adds a mine ownership layer before the production-based account. These diagrams are based on the GLORIA MRIO, available at https://ielab.info/, as well as on S&P Global data for mine ownership.

CCG Critical Minerals WebGIS Dashboard
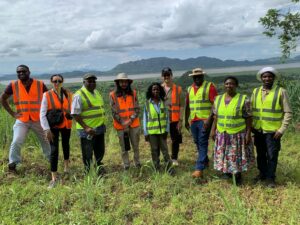
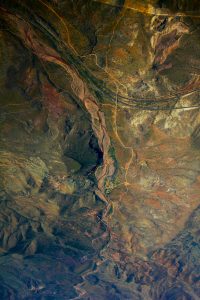
The CCG Critical Minerals Dashboard is developed by researchers at the University of Cambridge within the Climate Compatible Growth project, supported by the Cambridge Centre for Geopolitics (CCG). It is intended to support research, policy, and education by offering a transparent and interactive view of the spatial dynamics of mineral resources and their broader context.

Critical Minerals Supply Chain News Dashboard
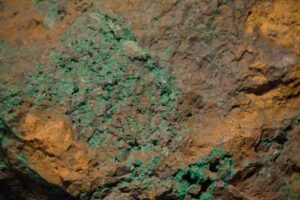
Potential disruptions to critical minerals (CM) supply chains pose a significant risk to manufacturers dependent CMs for their products. Disruptions and shocks can occur at any stage of the CM value chain, including during the extraction and refining of minerals, the manufacturing of components, the assembly of products and the final sale of technologies. Understanding the likelihood and impact of these risks can be provided through exploring historical and real time disruptions, as described in news providers. However, no tool currently exists to collate news stories of disruptions, across the CM value chains, and visualize these to aid understanding of the risks.
In response, we have developed a new dashboard to collate stories of disruptions and shocks along the supply chains of critical minerals. (This builds upon a previous version of the dashboard released in March 2024.) The dashboard allows exploration across the entire supply chains of CMs, grouped into three stages:
- upstream stage: mining, extraction and primary production;
- Midstream stage: mineral processing and refining into chemical compounds suitable for manufacturing;
- downstream stage: technology manufacturing and end-use.
The dashboard focuses on the CM supply chains for anodes, cathodes, batteries, solar panels and wind turbines, which have been identified as important in previous research [1], [2].
The new articles are analysed to understand the nature of the disruption risk, using the risk categories from Sun, 2022 [3]. This groups the types of risks into four categories: upstream, midstream, downstream and general, as shown in Figure 1.