


Resource Use in Poland in 2019: Challenges and Opportunities
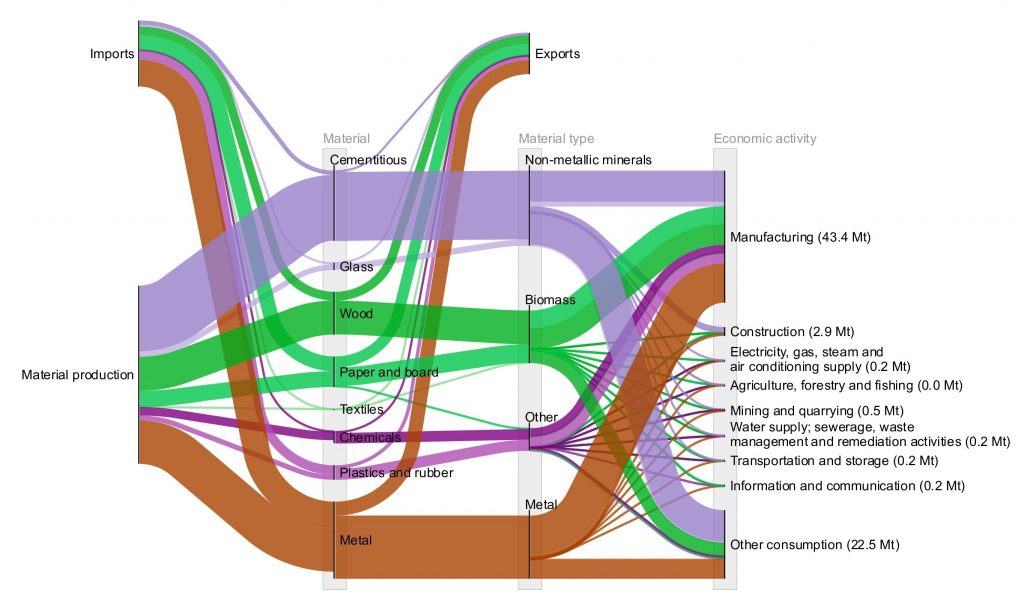
For this study, energy and material flows are visualised in the form of Sankey diagrams [1] where material and energy flows are traced from material and energy sources, through to the end use sectors. The width of each flow indicates the magnitude of the resource flow, measured in mass (Mt) or energy (TJ) units.
Visualising Poland’s resource use in this way allows the scale of resource flows to be compared side by side, and indicates where actions might be taken to improve the efficiency of resource use.
The industrial sector has the largest share in direct energy use (34.6%) in 2019, from activities such as manufacturing, mining and quarrying, electricity and water supply. The transport sector is the second largest user of energy (28.1%), with households using 21.7%, agriculture 4.5%, construction 1.7% and other consumers 9.4%.
Water use is by far the largest material use by mass. However, fossil fuels still dominate territorial CO2 emissions, with the combustion of lignite and steam coal contributing 63% of emissions and oil use contributing 26%. Almost half of all CO2 emissions (49%) results from the generation of electricity and heat with solid fossil fuels being the dominant fuel.
This report analyses the flows of material and energy separately. The authors propose that a logical next step is to extend the analysis to consider energy and material flows in the same units, using exergy. Using exergy would allow a direct comparison between the useful outputs of industry and all the required inputs. The focus on energy and materials, and the interactions between them, might contribute to identify opportunities for reducing resource use that would not be identified otherwise. Good resource management enables: waste avoidance, wise use of scarce resources, cost reduction, responsiveness to future regulation, and perhaps most importantly, reduction in industrial energy related CO2 emissions [2].
Read the full paper from Michal, Jonathan, Karla and José here: Resource use in Poland in 2019: Challenges and opportunities
[1] Schmidt, M., The Sankey Diagram in Energy and Material Flow Management. Journal of Industrial Ecology, 2008. 12(1): p. 82-94.
[2] Cullen, J.M., et al., Visualising resource efficiency energy-intensive industry in Poland. 2018, University of Cambridge: Cambridge.
Photo credit: Danist Soh